A Protocol to Bridge Phylogeny and GCN
Represent phylogenetic trees as graphs for neural learning.
Visualizing phylogenies
A phylogenetic tree is a diagram that illustrates how species or groups have evolved from common ancestors over time. In a time-calibrated phylogenetic tree, the edges have lengths, which can be interpreted as the time taken to evolve from the ancestors to the descendants.
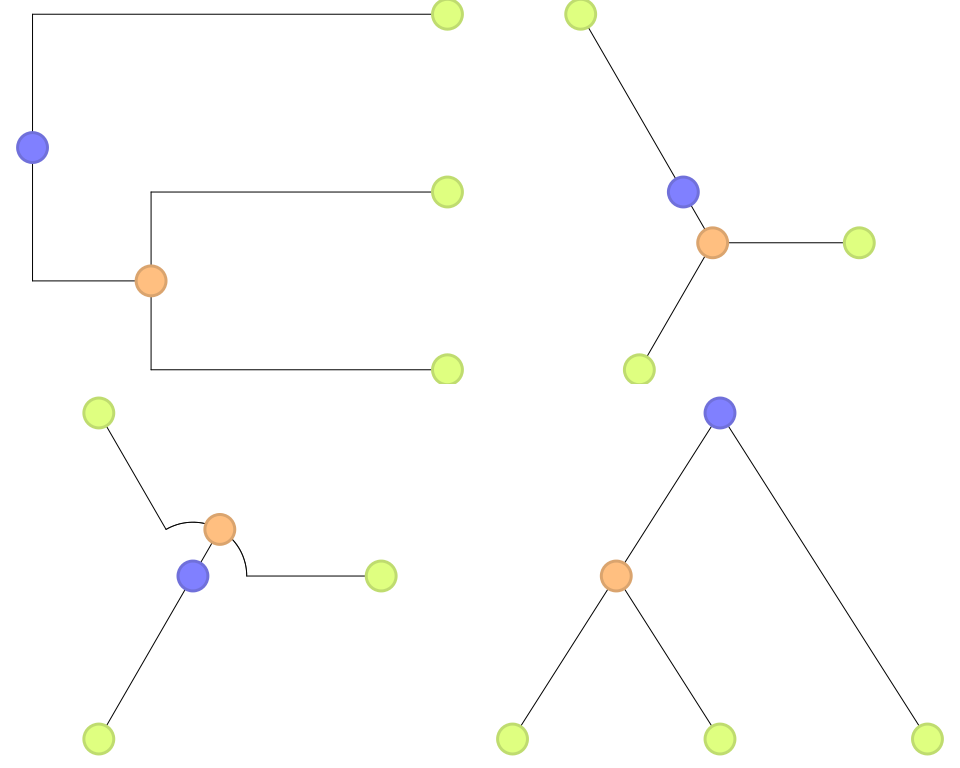
Phylogenies can be visualized in many distinct layouts. While these layouts have different appearances, they all maintain identical topological relationships between nodes and edges.
Phylogenies as graphs
Phylogenetic trees are essentially graphs. In a phylogeny, each node represents a species or a common ancestor, and each edge represents the evolutionary connection between them.
Below I provide you an interactive playground, in which you can explore the forms of a phylogeny/graph.
You can specify a tip number and click on the "Generate Tree" button below to simulate a phylogenetic tree under the Yule model.
Click on "Phylogeny Form" and "Graph Form" to switch between common layouts of phylogeny and graph. Click on the rotation buttons to display the tree in a different pose. If you like, you can also drag the nodes around.
Enter number of tips:
The arrows show edge direction. The tables below the graph show its edge list and node features.
A rooted phylogeny records ancestor-to-descendant edges. Graph learning libraries use the directions supplied in the edge list. To pass messages in both directions, include each edge and its reverse.
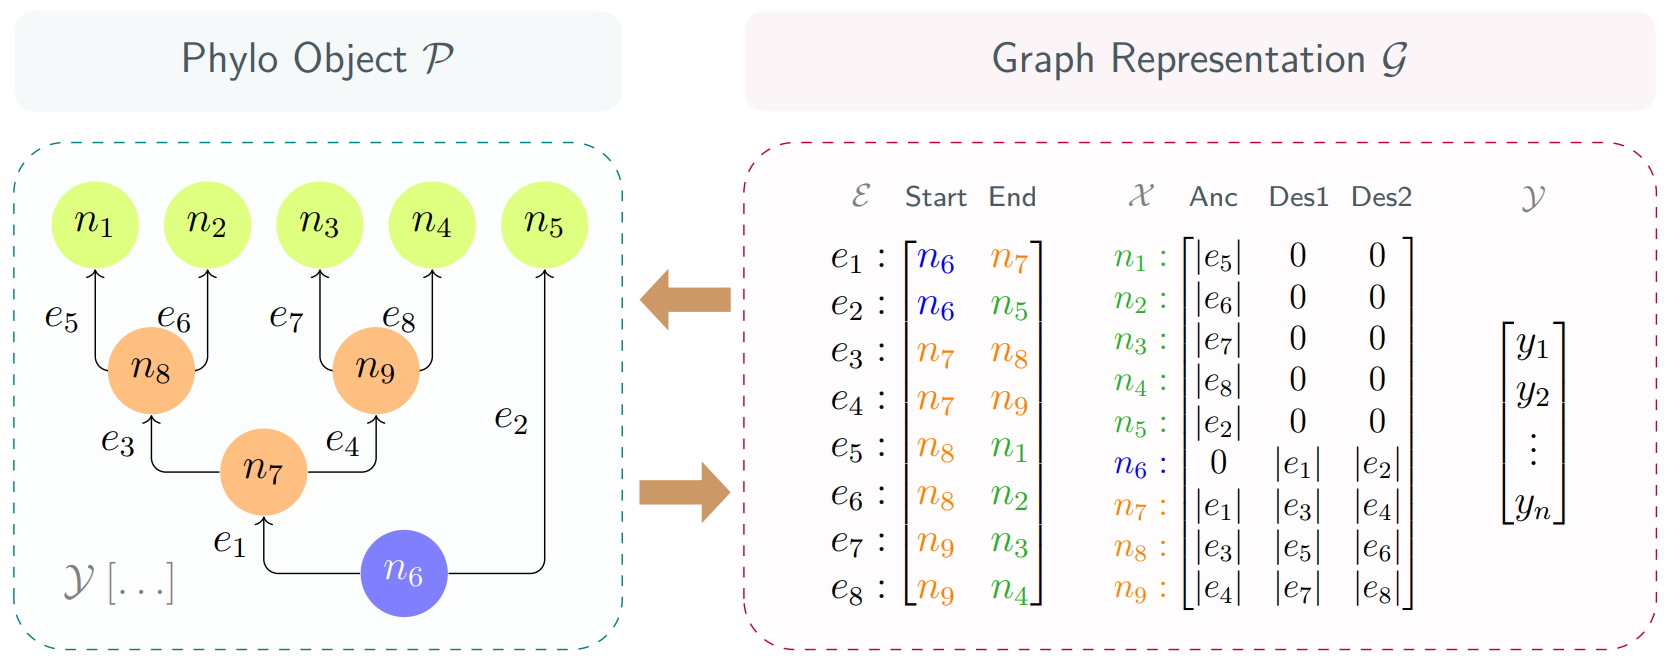
How exactly are phylogenies encoded conventionally? The core idea is to maintain an edge list. The list stores all the edges in the format [ni, nj], where ni and nj are the starting and ending nodes of the edge.
When you hover over an edge or node in the graph, its associated entries in the edge list will be highlighted. Similarly, hovering over a row or element in the list will highlight the corresponding node or edge in the tree. This interactive highlighting helps to easily trace connections and understand how an edge list sufficiently encodes a phylogeny.
The next section explains the node feature matrix.
From phylogenies to graph learning
Graph Convolutional Networks (GCNs) are a type of neural network specifically designed to operate on graph-structured data. Unlike traditional convolutional networks that work on regular grid data like images, GCNs can process data represented as nodes and edges. The core idea of GCNs is to aggregate features from a node's neighbors to capture both local graph topology and feature information. This is achieved through convolutional operations that combine and transform node features based on their connections. Visit Thomas Kipf's original blog for more information.
I proposed a protocol to directly embed the evolutionary relationships (lengths of adjacent edges) into the nodes as their features. This protocol does not require the involvement of edge features in computation.
Each row of the node feature matrix stores features of a node in the format [ei, ej, ek], where ei is the length of the edge connecting the node to its ancestor, ej and ek are the lengths of the edges connecting the node to its two descendants.